
 June 10, 2022
Update: AAA says the national average is now almost $5.00 a gallon (and much higher in places like California). That moves the blue dot on the chart below up and prices are now well above inflation-adjusted peaks!
June 2, 2022
It’s no secret that gasoline prices are skyrocketing. However, a couple of months ago we said that although gas prices were high and rising, they still weren’t at record levels when looked at in inflation-adjusted terms.
But all that has changed now as gasoline prices continue to climb upward. Today the AAA reported the highest national gas prices they have recorded.

Although this is a significant development, all sorts of prices are making new highs all the time simply due to overall inflation. But, gas prices are different. Although we tend to think that they are always going up that isn’t true. Gas prices have been in a relative downtrend for almost a decade.
The nationwide average annual price of Regular Gasoline peaked at $3.55 way back in 2012 and steadily fell from there. The inflation adjusted price in April 2022 dollars would have been $4.47. So until gasoline prices climbed above $4.47 we may have had the nominal highest prices but in terms of purchasing power there were worse periods.
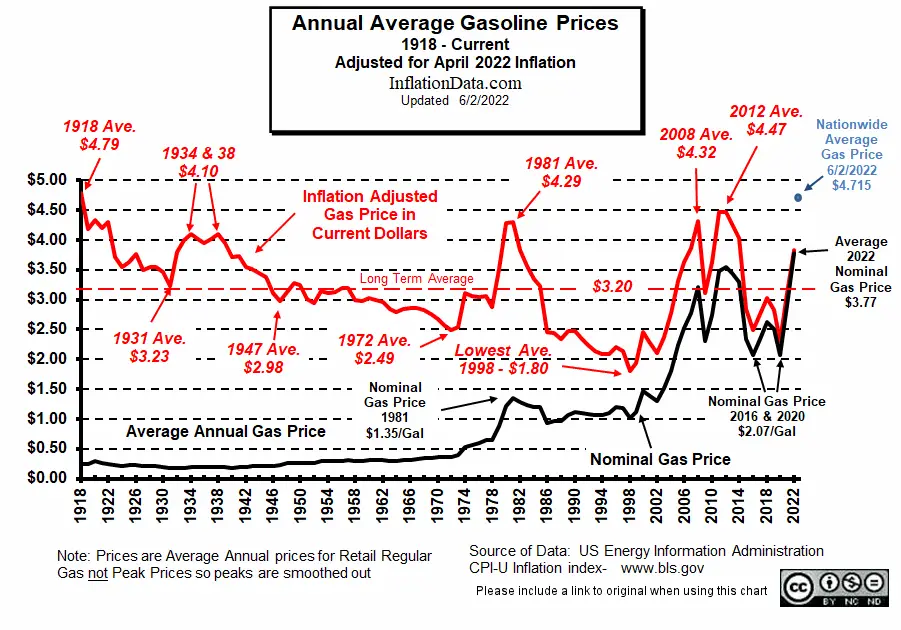 Looking at the above chart we can see the relationship between the nominal price (i.e. the price you would have actually paid at the pump) and the inflation adjusted price (i.e. the equivalent price in 2022 dollars). However, sharp eyed people will notice that the current annual average hasn’t exceeded the 2012 annual average. But the June 2, 2022 price is higher than the inflation adjusted 2012 annual average gasoline price.
If the current spike is short lived it is still possible that the annual average for 2022 will end up lower than 2012’s annual average but only time will tell.
But What about Peak Prices?
The peak in 2012 occurred during the week of April 9th 2012, at $3.877. Current prices are certainly above $3.877. The annual average price is almost that high. But to get a true picture we have to look at the inflation adjusted price of gas back then. In April of 2012 the CPI index was 230.085 and it is currently 289.109 so overall prices were 79.6% of what they are today or 20.4% lower. So if we adjust the $3.877 price of gas up by 20.4% due to inflation, we get a price of $4.87 as a peak for the 2012 year. So, although at $4.715 we are close to the inflation adjusted peak we aren’t quite there yet. Although, a month ago gas prices were “only” $4.19 so if we get another month like this one we will certainly be above the inflation adjusted peak of 2012.
Also, the peak was fairly short lived in 2012 and by the end of the year prices were back down to $3.254 so even if prices don’t exceed the peak if they stay at current levels the annual average could still be higher than in 2012.
Historical Gas Prices:
Can you guess what year this was?

The last time regular gasoline averaged $0.27 for the entire year was 1951 but it was in the low .30s during the early 1960s and there were could have been some brief periods where you might see a sign like this.
Can you guess what year this was? This one might be a little easier based on the girl’s clothes…

In 1979 gas averaged $0.88 a gallon, so 1980 was the first year that it climbed over a dollar a gallon. It averaged $1.22 in 1980 so it could have been $1.30 in some places. By 1981 gasoline prices averaged $1.35 for the year so it was most likely taken in 1981.
We’ve updated the inflation adjusted price of gasoline page.
Data Sources:
You might also like:
- Annual Inflation Chart
- Gasoline vs. Crude Oil Prices
- Historical Gas Price Chart
- Current Average Cost of Gas by County
- Gasoline Taxes by State
- Average Cost of Gas Per Month
- Calculating Miles Per Gallon
- Regarding Gas Inflation
- Historical Oil Prices Chart
- More Inflation Adjusted Prices
- Crude Oil and Gold
- Oil, Petrodollars and Gold
Read more on InflationData.com.